Ceph Upmap Balancer Lab
Contents
Introduction⌗
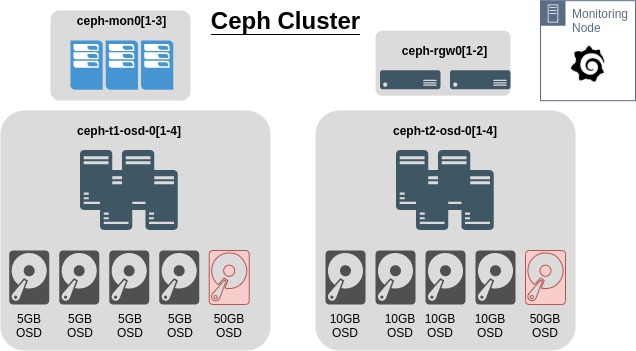
Using the Ceph Octopus lab setup previously with RadosGW nodes, this will attempt to simulate a cluster where OSD utilisation is skewed. In the cluster, each node has an extra 50G OSD to help try and skew the usage percentages on the OSDs.
This is the current configuration of the cluster
This all comes from this video, a highly recommenced watch, from Cephalocon 2019
Test Setup⌗
In summary, the cluster will have data added to it using s3cmd. There will be two buckets created, one for ISO’s and other large images, and another for loads of photos and other small files. This should take the cluster to roughly 60% capacity.
Requirements⌗
- Ensure the Ceph balancer is off
# ceph balancer off
# ceph balancer status
- Expected output
{
    "active": false,
    "last_optimize_duration": "",
    "last_optimize_started": "",
    "mode": "none",
    "optimize_result": "",
    "plans": []
}
Setup s3cmd⌗
- Install s3cmd
# dnf install s3cmd
- Configure s3cmd to connect to the cluster using the keys created in this previous step
# cat <<EOF > ~/.ceph_s3cfg
[default]
access_key = 4IMSY2D3RPWW7VB7ECPB
secret_key = 7AuFEvU9HKa4WB6BjfuTlZEDv6t1oHKhQ01zmIDo
host_base = ceph-rgw01.ceph.lab
# If wildcard DNS is configured
# host_bucket = %(bucket)s.ceph-rgw01.ceph.lab
# If no wildcrds DNS
host_bucket = ceph-rgw01.ceph.lab
# If a proxy host is needed to reach the RGW nodes
#proxy_host = 192.168.0.15
#proxy_port = 8888
# If SSL has not been enabled on RGW
use_https = False
human_readable_sizes = True
EOF
Modify ~/.ceph_s3cfg as required. Alternatively modify ~/.s3cfg if this will be the only cluster s3cmd will connect to.
- Create two buckets
# s3cmd -c ~/.ceph_s3cfg mb s3://isos
# s3cmd -c ~/.ceph_s3cfg mb s3://photos
Seed Test Data⌗
- Sync local directories via s3cmd
This will probably take a while, depending on the amount of data, speed of the Ceph drives etc. May be useful to setup a custom Grafana Dashboard to ensure Upmap is working as intended
# s3cmd -c ~/.ceph_s3cfg sync /var/lib/libvirt/images/iso/ s3://isos/
# s3cmd -c ~/.ceph_s3cfg sync ~/Photos s3://photos/
- Check files are accessible
# s3cmd -c ~/.ceph_s3cfg ls s3://isos/
2021-01-14 10:30    858783744  s3://isos/CentOS-7-x86_64-GenericCloud.qcow2
- Check the size of the buckets
# s3cmd -c ~/.ceph_s3cfg du s3://isos/
12G      12 objects s3://isos/
Setup Custom Grafana Dashboard⌗
Using either the default Grafana setup or the monitoring set up here, log into Grafana as admin
- Import a new dashboard from this JSON
{
  "annotations": {
    "list": [
      {
        "builtIn": 1,
        "datasource": "-- Grafana --",
        "enable": true,
        "hide": true,
        "iconColor": "rgba(0, 211, 255, 1)",
        "name": "Annotations & Alerts",
        "type": "dashboard"
      }
    ]
  },
  "editable": true,
  "gnetId": null,
  "graphTooltip": 0,
  "id": 16,
  "links": [],
  "panels": [
    {
      "aliasColors": {},
      "bars": false,
      "dashLength": 10,
      "dashes": false,
      "datasource": "Dashboard1",
      "decimals": 0,
      "description": "Space used on each OSD represented as a percentage of total space available",
      "fill": 0,
      "fillGradient": 0,
      "gridPos": {
        "h": 7,
        "w": 24,
        "x": 0,
        "y": 0
      },
      "hiddenSeries": false,
      "id": 4,
      "legend": {
        "alignAsTable": true,
        "avg": false,
        "current": true,
        "max": false,
        "min": false,
        "rightSide": true,
        "show": true,
        "sort": "current",
        "sortDesc": true,
        "total": false,
        "values": true
      },
      "lines": true,
      "linewidth": 1,
      "nullPointMode": "null",
      "options": {
        "dataLinks": []
      },
      "percentage": false,
      "pointradius": 2,
      "points": false,
      "renderer": "flot",
      "seriesOverrides": [],
      "spaceLength": 10,
      "stack": false,
      "steppedLine": false,
      "targets": [
        {
          "expr": "(ceph_osd_stat_bytes_used{instance=~\"$mgr\"}  / ceph_osd_stat_bytes{instance=~\"$mgr\"} * 100)",
          "instant": false,
          "legendFormat": "{{ ceph_daemon }}",
          "refId": "A"
        }
      ],
      "thresholds": [],
      "timeFrom": null,
      "timeRegions": [],
      "timeShift": null,
      "title": "OSD Space Used",
      "tooltip": {
        "shared": true,
        "sort": 2,
        "value_type": "individual"
      },
      "type": "graph",
      "xaxis": {
        "buckets": 25,
        "min": null,
        "mode": "time",
        "name": null,
        "show": true,
        "values": []
      },
      "yaxes": [
        {
          "format": "percent",
          "label": null,
          "logBase": 1,
          "max": null,
          "min": null,
          "show": true
        },
        {
          "decimals": null,
          "format": "short",
          "label": "",
          "logBase": 1,
          "max": null,
          "min": null,
          "show": true
        }
      ],
      "yaxis": {
        "align": false,
        "alignLevel": null
      }
    },
    {
      "aliasColors": {},
      "bars": true,
      "dashLength": 10,
      "dashes": false,
      "datasource": "Dashboard1",
      "description": "Each bar indicates the number of OSD's that have a PG count in a specific range as shown on the x axis.",
      "fill": 1,
      "fillGradient": 0,
      "gridPos": {
        "h": 8,
        "w": 24,
        "x": 0,
        "y": 7
      },
      "hiddenSeries": false,
      "id": 2,
      "legend": {
        "avg": false,
        "current": false,
        "max": false,
        "min": false,
        "show": false,
        "total": false,
        "values": false
      },
      "lines": false,
      "linewidth": 1,
      "nullPointMode": "null",
      "options": {
        "dataLinks": []
      },
      "percentage": false,
      "pointradius": 2,
      "points": false,
      "renderer": "flot",
      "seriesOverrides": [],
      "spaceLength": 10,
      "stack": false,
      "steppedLine": false,
      "targets": [
        {
          "expr": "ceph_osd_numpg",
          "instant": true,
          "legendFormat": "PGs per OSD",
          "refId": "A"
        }
      ],
      "thresholds": [],
      "timeFrom": null,
      "timeRegions": [],
      "timeShift": null,
      "title": "Distribution of PGs per OSD",
      "tooltip": {
        "shared": false,
        "sort": 0,
        "value_type": "individual"
      },
      "type": "graph",
      "xaxis": {
        "buckets": 20,
        "min": null,
        "mode": "histogram",
        "name": null,
        "show": true,
        "values": []
      },
      "yaxes": [
        {
          "format": "short",
          "label": "# of OSDs",
          "logBase": 1,
          "max": null,
          "min": null,
          "show": true
        },
        {
          "format": "short",
          "label": null,
          "logBase": 1,
          "max": null,
          "min": null,
          "show": true
        }
      ],
      "yaxis": {
        "align": false,
        "alignLevel": null
      }
    }
  ],
  "refresh": "10s",
  "schemaVersion": 22,
  "style": "dark",
  "tags": [],
  "templating": {
    "list": [
      {
        "allValue": null,
        "current": {
          "text": "ceph-mon02:9283",
          "value": "ceph-mon02:9283"
        },
        "datasource": "Dashboard1",
        "definition": "label_values(ceph_osd_stat_bytes_used, instance)",
        "hide": 0,
        "includeAll": false,
        "label": "mgr",
        "multi": false,
        "name": "mgr",
        "options": [],
        "query": "label_values(ceph_osd_stat_bytes_used, instance)",
        "refresh": 2,
        "regex": "",
        "skipUrlSync": false,
        "sort": 0,
        "tagValuesQuery": "",
        "tags": [],
        "tagsQuery": "",
        "type": "query",
        "useTags": false
      }
    ]
  },
  "time": {
    "from": "now-1h",
    "to": "now"
  },
  "timepicker": {
    "refresh_intervals": [
      "5s",
      "10s",
      "30s",
      "1m",
      "5m",
      "15m",
      "30m",
      "1h",
      "2h",
      "1d"
    ]
  },
  "timezone": "",
  "title": "Upmap Dashboard",
  "uid": "yU-29mBMk",
  "version": 5
}
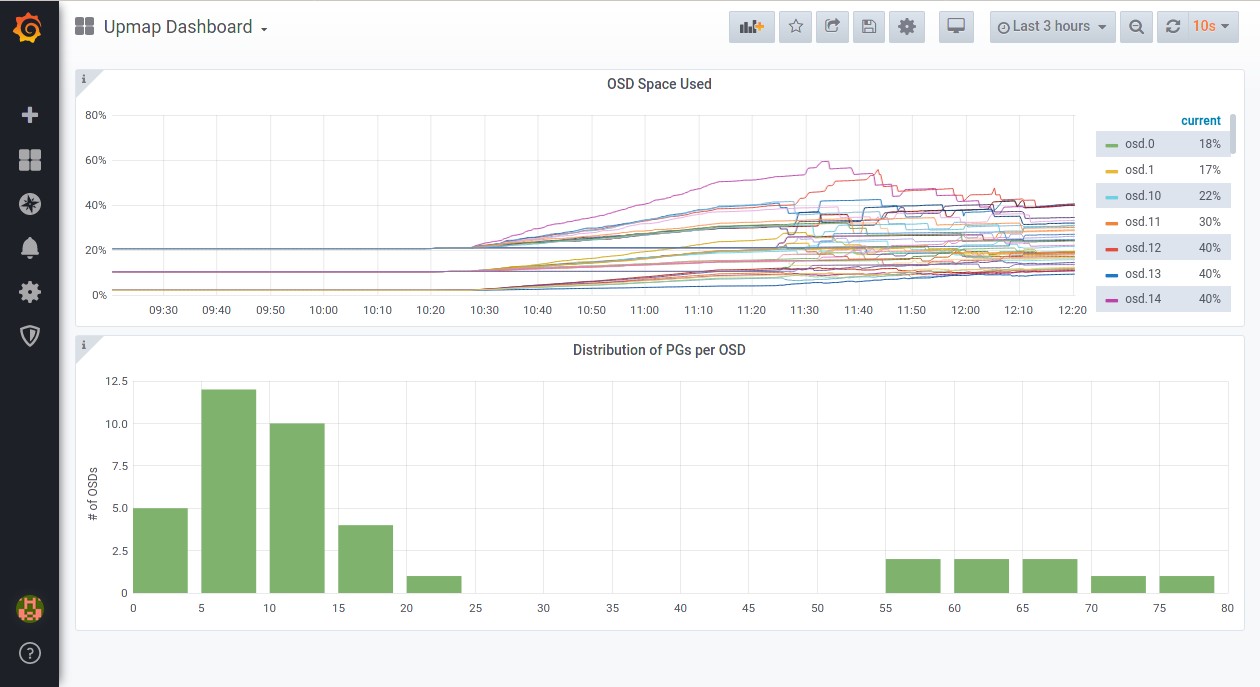
- The new dashboard should look something like this
Enable the Upmap Balancer⌗
Steps below will be following the instructions from Ceph docs to enable the Upmap balancer.
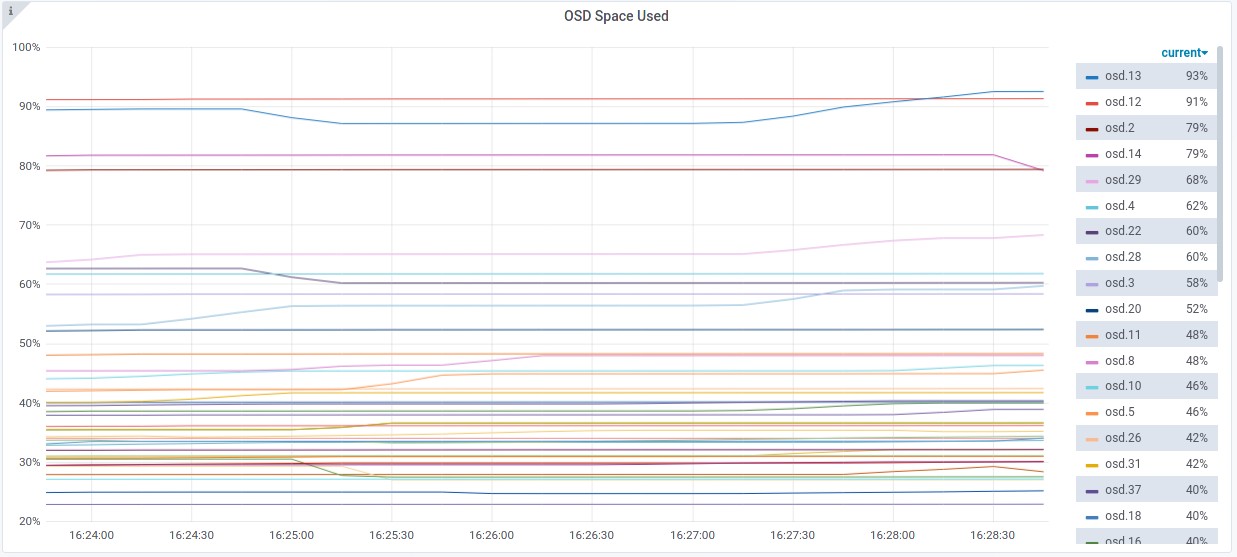
Current State of the Cluster⌗
As the first image shows, there are 2 OSDs at over 90% utilisation. with the lowest utilised OSD at 23%

- Most utilised OSDs
# ceph osd df | sort -nr -k 17 | head -n 5
ID  CLASS  WEIGHT   REWEIGHT  SIZE     RAW USE  DATA     OMAP     META      AVAIL    %USE   VAR   PGS  STATUS
13    hdd  0.00490   1.00000  5.0 GiB  4.7 GiB  3.7 GiB    6 KiB  1024 MiB  264 MiB  94.85  2.58   33      up
12    hdd  0.00490   1.00000  5.0 GiB  4.6 GiB  3.6 GiB    5 KiB  1024 MiB  442 MiB  91.37  2.49   34      up
 2    hdd  0.00490   1.00000  5.0 GiB  4.0 GiB  3.0 GiB    6 KiB  1024 MiB  1.0 GiB  79.47  2.16   25      up
14    hdd  0.00490   1.00000  5.0 GiB  4.0 GiB  3.0 GiB    5 KiB  1024 MiB  1.0 GiB  79.26  2.16   23      up
29    hdd  0.00490   1.00000  5.0 GiB  3.5 GiB  2.5 GiB    5 KiB  1024 MiB  1.5 GiB  70.21  1.91   24      up
- Least utilised OSDs
ID  CLASS  WEIGHT   REWEIGHT  SIZE     RAW USE  DATA     OMAP     META      AVAIL    %USE   VAR   PGS  STATUS
 9    hdd  0.00980   1.00000   10 GiB  2.4 GiB  1.4 GiB    5 KiB  1024 MiB  7.6 GiB  24.45  0.67   17      up
35    hdd  0.04880   1.00000   50 GiB   13 GiB   12 GiB   10 KiB  1024 MiB   37 GiB  25.44  0.70  134      up
30    hdd  0.00490   1.00000  5.0 GiB  1.3 GiB  294 MiB    4 KiB  1024 MiB  3.7 GiB  25.76  0.70    4      up
24    hdd  0.00980   1.00000   10 GiB  2.7 GiB  1.7 GiB    4 KiB  1024 MiB  7.3 GiB  27.14  0.74   20      up
25    hdd  0.00980   1.00000   10 GiB  2.8 GiB  1.8 GiB    6 KiB  1024 MiB  7.2 GiB  28.41  0.78   17      up
- Standard deviation is at 19.19
# ceph osd df | grep -i stddev
MIN/MAX VAR: 0.67/2.53  STDDEV: 19.24
Starting the Upmap Balancer⌗
- Check
min_compat_client
# ceph osd get-require-min-compat-client
jewel
- Update
min_compat_clientif it is less then luminous
If there are pre-luminous clients connecting to the cluster this will cause issues.
# ceph osd set-require-min-compat-client luminous
- Set the balancer mode to
upmap
# ceph balancer mode upmap
- Confirm this has been setup
# ceph balancer status
Expected output
{
    "active": false,
    "last_optimize_duration": "",
    "last_optimize_started": "",
    "mode": "upmap",
    "optimize_result": "",
    "plans": []
}
Start the balancer
# ceph balancer on
- Check the balancer is running
# ceph balancer status
- Expected output
{
    "active": true,
    "last_optimize_duration": "0:00:00.000709",
    "last_optimize_started": "Thu Jan 14 16:45:55 2021",
    "mode": "upmap",
    "optimize_result": "Some objects (0.024766) are degraded; try again later",
    "plans": []                                                                         Home (GL2 4XN)
}
At this point the cluster will start rebalancing data.
ceph -swill show pgs being remapped to optimise data placement. The grafana graph should start to show the OSD utilisation percentages averaging out.
- Once the balancer has completed, it will show a message similar to below. All I/O was stopped on the cluster overnight while it rebalanced so if this isn’t the case it is likely the balancer will continue balancing data.
# ceph balancer status
- Output
{
    "active": true,
    "last_optimize_duration": "0:00:00.010837",
    "last_optimize_started": "Fri Jan 15 08:33:38 2021",
    "mode": "upmap",
    "optimize_result": "Unable to find further optimization, or pool(s) pg_num is decreasing, or distribution is already perfect",
    "plans": []
}
Summary⌗
Data utilisation across the OSDs is a lot healthier. Considering the size differences in the drives, this is pretty good. Highest utilisation is 65%, lowest is 31%.
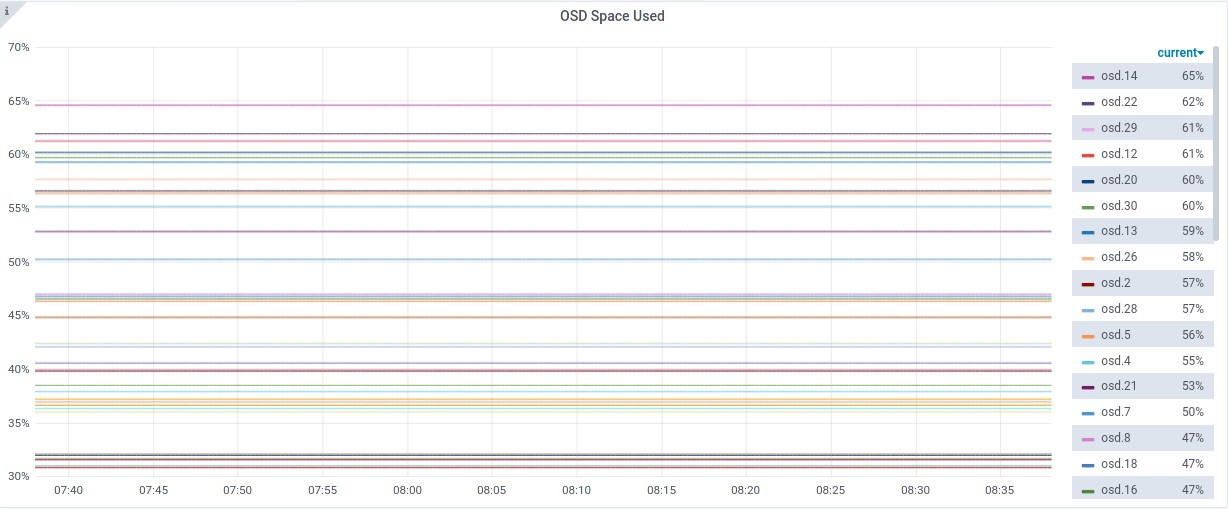
Considering it unlikely that there would be drives 10x larger than others in the same CRUSH hierarchy in a production environment, balancing this lab cluster was very efficient. A future lab will take look into the crush-compat balancer mode and compare the balancing effect on this cluster.
To clean up this lab, use the script here.